HydroSignatures: Tools for computing hydrological signatures#


Features#
HydroSignatures is a suite of tools for computing hydrological signatures and a part of HyRiver software stack. This package includes the following functions:
exceedance: Exceedance probability that can be used plotting flow duration curves;flow_duration_curve_slope: Slope of flow duration curve;flashiness_index: Flashiness index;mean_monthly: Mean monthly summary of a time series that can be used for plotting regime curves;rolling_mean_monthly: Rolling mean monthly summary of a time series that can be used for plotting smoothed regime curves;baseflow: Extracting baseflow from a streamflow time series using the Lyne and Hollick digital filter (Ladson et al., 2013);baseflow_recession: Baseflow recession analysis using the nonparametric analytic (Posavec et al., 2006) and exponential fit methods;baseflow_index: Baseflow index;aridity_index: Aridity index;seasonality_index_walsh: Seasonality index (Walsh and Lawler, 1981);seasonality_index_markham: Seasonality index (Markham, 1970);extract_extrema: Determining the location of local maxima and minima in a time series;
Moreover, the package has a class called HydroSignatures that can be used to compute
all these signatures by passing a streamflow and a precipitation time series, both
in millimeters per day (or any other unit of time). This class supports subtraction
and inequality operators, which can be used to compare two HydroSignatures objects.
You can serialize the class to a JSON object using the to_json method or convert it
to a dictionary using the to_dict method.
Moreover, numba is an optional dependency for the baseflow function.
Installing numba will speed up the computation of baseflow significantly.
For more efficient handling of NaN values, you can also install numbagg.
You can also try using HydroSignatures without installing it on your system by clicking on the binder badge. A Jupyter Lab instance with the HyRiver stack pre-installed will be launched in your web browser, and you can start coding!
Moreover, requests for additional functionalities can be submitted via issue tracker.
Citation#
If you use any of HyRiver packages in your research, we appreciate citations:
@article{Chegini_2021,
    author = {Chegini, Taher and Li, Hong-Yi and Leung, L. Ruby},
    doi = {10.21105/joss.03175},
    journal = {Journal of Open Source Software},
    month = {10},
    number = {66},
    pages = {1--3},
    title = {{HyRiver: Hydroclimate Data Retriever}},
    volume = {6},
    year = {2021}
}
Installation#
You can install HydroSignatures using pip:
$ pip install hydrosignatures
or from the conda-forge repository using Conda
or Mamba:
$ conda install -c conda-forge hydrosignatures
Quick start#
Let’s explore the capabilities of HydroSignatures by getting streamflow
using PyGeoHydro, basin geometry using PyNHD and precipitation using PyDaymet.
In this example, we select West Branch Herring Run At Idlewylde, MD, as the
watershed of interest and compute the hydrological signatures for the period
from 2010 to 2020.
import pydaymet as daymet
import hydrosignatures as hs
import pygeohydro as gh
from hydrosignatures import HydroSignatures
from pygeohydro import NWIS
from pynhd import WaterData

site = "01585200"
start = "2010-01-01"
end = "2020-12-31"
First, we get the basin geometry of the watershed using gagesii_basins layer of
the USGS’s WaterData web service.
wd = WaterData("gagesii_basins")
geometry = wd.byid("gage_id", site).geometry[0]
Then, we obtain the station’s info and streamflow data using NWIS. Note that we should convert the streamflow from cms to mm/day.
nwis = NWIS()
info = nwis.get_info({"site": site})
area_sqm = info.drain_sqkm.values[0] * 1e6
q_cms = nwis.get_streamflow(site, (start, end))
q_mmpd = q_cms * (24.0 * 60.0 * 60.0) / area_sqm * 1e3
q_mmpd.index = pd.to_datetime(q_mmpd.index.date)
Next, we retrieve the precipitation data using PyDaymet over the whole basin using the basin geometry and take its mean as the basin’s precipitation.
prcp = daymet.get_bygeom(geometry, (start, end), variables="prcp")
p_mmpd = prcp.prcp.mean(dim=["x", "y"]).to_pandas()
p_mmpd.index = pd.to_datetime(p_mmpd.index.date)
q_mmpd = q_mmpd.loc[p_mmpd.index]
Now, we can pass these two to the HydroSignatures class:
sig = HydroSignatures(q_mmpd, p_mmpd)
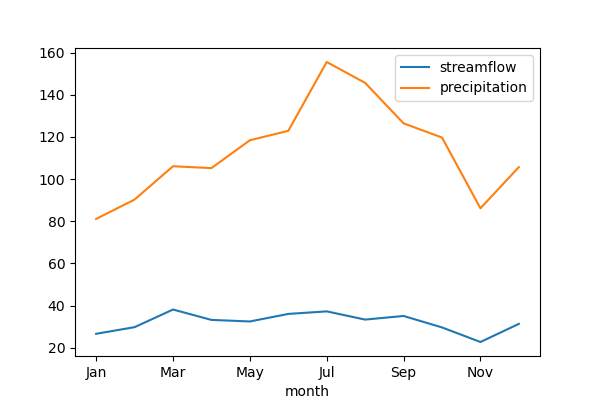
The values property of this class contains the computed signatures. For example,
let’s plot the regime curves:
sig.values.mean_monthly.plot()
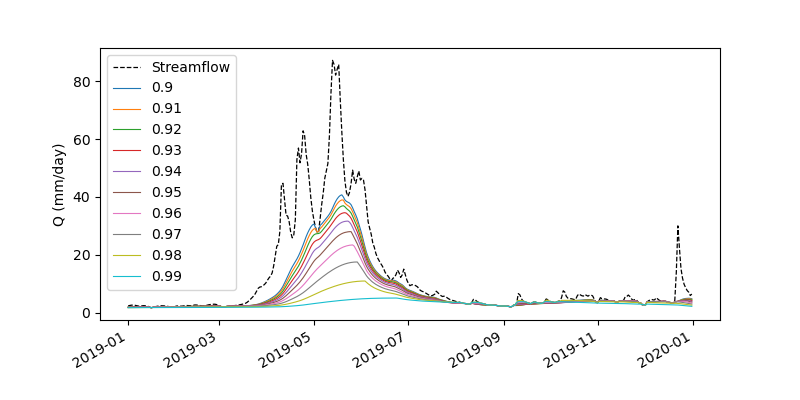
Note that, you can also use the functions directly. For example, let’s get streamflow observations for another station and separate the baseflow using various filter parameters and compare them:
import numpy as np
import pandas as pd

q = nwis.get_streamflow("12304500", ("2019-01-01", "2019-12-31"))
alpha = np.arange(0.9, 1, 0.01)
qb = pd.DataFrame({a: hs.baseflow(q.squeeze(), alpha=a) for a in alpha})
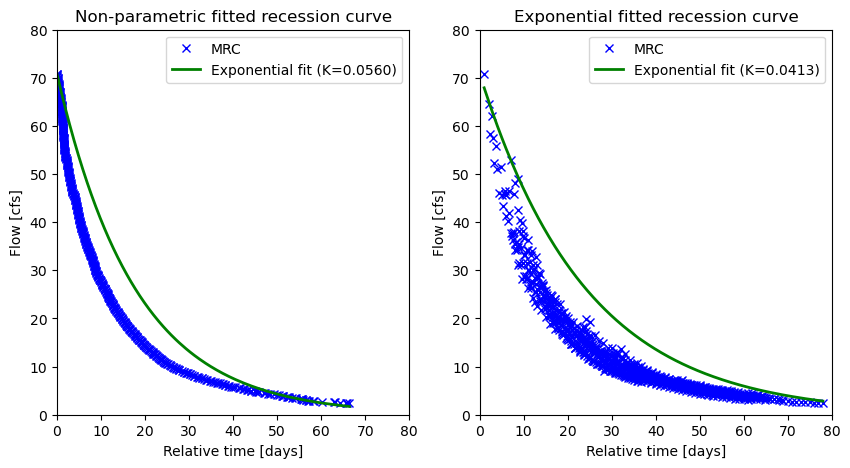
We can also carry out a baseflow recession analysis using the baseflow_recession
function. For this we need to get streamflow data for a longer period.
q = nwis.get_streamflow("12304500", ("2000-01-01", "2019-12-31"))
mrc_np, bfr_k_np = hs.baseflow_recession(q, fit_method="nonparametric_analytic")
mrc_exp, bfr_k_exp = hs.baseflow_recession(q, fit_method="exponential")
According to Safeeq et al. (2013), $K$ value of $0.065$ is the threshold between groundwater dominated slow-draining systems and shallow subsurface flow dominated fast draining systems. In this example, since $K= 0.056$, the watershed is groundwater dominated.
Lastly, let’s compute Markham’s seasonality index for all streamflow time series of the stations in the CAMELS dataset. We retrieve the CAMELS dataset using PyGeoHydro:
import xarray as xr

_, camels_qobs = gh.get_camels()
discharge = camels_qobs.discharge.dropna("station_id")
discharge = xr.where(discharge < 0, 0, discharge)
si = hs.seasonality_index_markham(discharge.to_pandas())
More examples can be found here.