This page was generated from gridmet.ipynb.
Interactive online version:
![]()
Climate Data from GridMET#
[1]:
from __future__ import annotations

from pathlib import Path

import matplotlib.pyplot as plt

import pygridmet as gridmet
from pygridmet import GridMET
from pynhd import NLDI
The Daymet database provides climatology data at 1-km resolution. First, we use PyNHD to get the contributing watershed geometry of a NWIS station with the ID of USGS-01318500:
[2]:
geometry = NLDI().get_basins("01318500").geometry.iloc[0]
PyGridMET allows us to get the data for a single pixel or for a region as gridded data. The function to get single pixel is called pygridmet.get_bycoords and for gridded data is called pygridmet.get_bygeom. The arguments of these functions are identical except the first argument where the latter should be polygon and the former should be a coordinate (a tuple of length two as in (x, y)).
The input geometry or coordinate can be in any valid CRS (defaults to EPSG:4326). The date argument can be either a tuple of length two like (start_str, end_str) or a list of years like [2000, 2005].
We can get a dataframe of available variables and their info by calling GridMET().gridmet_table.
[3]:
GridMET().gridmet_table
[3]:
| variable | abbr | long_name | units | |
|---|---|---|---|---|
| 0 | Precipitation | pr | precipitation_amount | mm |
| 1 | Maximum Relative Humidity | rmax | daily_maximum_relative_humidity | % |
| 2 | Minimum Relative Humidity | rmin | daily_minimum_relative_humidity | % |
| 3 | Specific Humidity | sph | daily_mean_specific_humidity | kg/kg |
| 4 | Surface Radiation | srad | daily_mean_shortwave_radiation_at_surface | W/m2 |
| 5 | Wind Direction | th | daily_mean_wind_direction | Degrees clockwise from north |
| 6 | Minimum Air Temperature | tmmn | daily_minimum_temperature | K |
| 7 | Maximum Air Temperature | tmmx | daily_maximum_temperature | K |
| 8 | Wind Speed | vs | daily_mean_wind_speed | m/s |
| 9 | Burning Index | bi | daily_mean_burning_index_g | - |
| 10 | Fuel Moisture (100-hr) | fm100 | dead_fuel_moisture_100hr | % |
| 11 | Fuel Moisture (1000-hr) | fm1000 | dead_fuel_moisture_1000hr | % |
| 12 | Energy Release Component | erc | daily_mean_energy_release_component-g | - |
| 13 | Reference Evapotranspiration (Alfalfa) | etr | daily_mean_reference_evapotranspiration_alfalfa | mm |
| 14 | Reference Evapotranspiration (Grass) | pet | daily_mean_reference_evapotranspiration_grass | mm |
| 15 | Vapor Pressure Deficit | vpd | daily_mean_vapor_pressure_deficit | kPa |
[4]:
dates = ("2000-01-01", "2000-01-06")
daily = gridmet.get_bygeom(geometry, dates, variables=["pr", "pet"])
[5]:
ax = daily.where(daily.pet > 0).pet.plot(x="lon", y="lat", row="time", col_wrap=3)
ax.fig.savefig(Path("_static", "gridmet_grid.png"), facecolor="w", bbox_inches="tight")
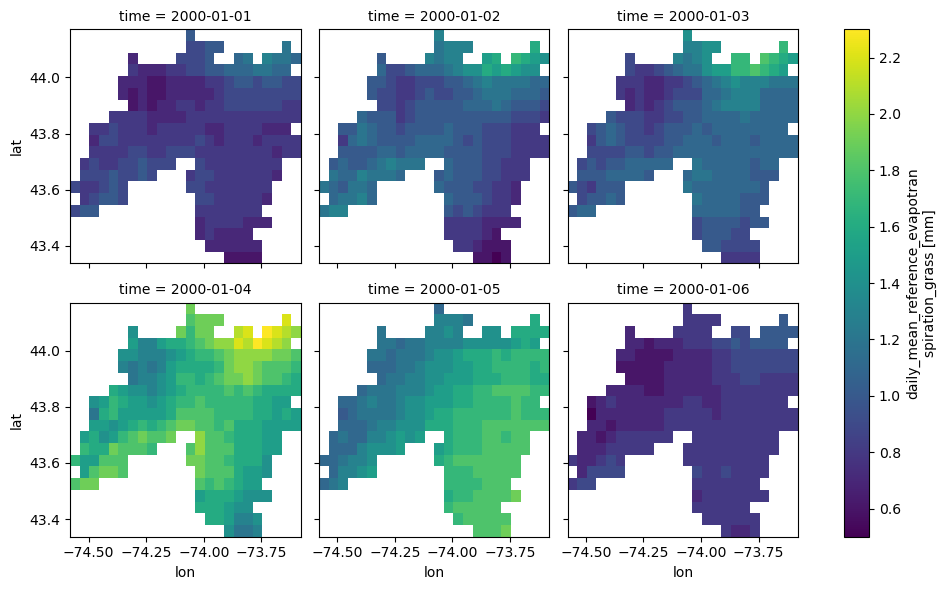
Note that the default CRS is EPSG:4326. If the input geometry (or coordinate) is in a different CRS we can pass it to the function. The gridded data are automatically masked to the input geometry. Now, Let’s get the data for a coordinate in EPSG:3542 CRS.
[6]:
coords = (-1431147.7928, 318483.4618)
crs = 3542
dates = ("2000-01-01", "2006-12-31")
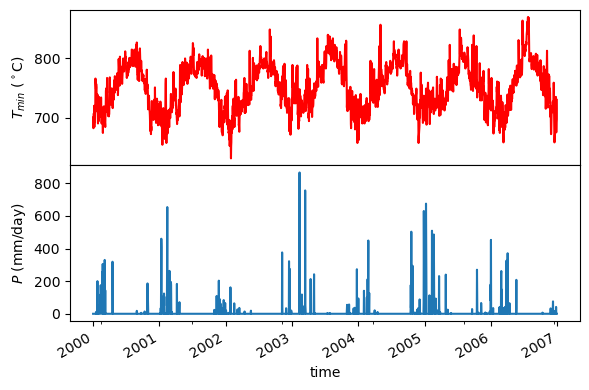
clm = gridmet.get_bycoords(coords, dates, variables=["pr", "tmmn"], crs=crs)
[7]:
fig = plt.figure(figsize=(6, 4), facecolor="w")

gs = fig.add_gridspec(1, 2)
axes = gs[:].subgridspec(2, 1, hspace=0).subplots(sharex=True)
clm["tmmn (K)"].plot(ax=axes[0], color="r")
axes[0].set_ylabel(r"$T_{min}$ ($^\circ$K)")
axes[0].xaxis.set_ticks_position("none")
clm["pr (mm)"].plot(ax=axes[1])
axes[1].set_ylabel("$P$ (mm/day)")

plt.tight_layout()
fig.savefig("_static/gridmet_loc.png", facecolor="w", bbox_inches="tight")